Audio Tube Noise Measurements
Table 1 below summarizes noise measurements on a variety of current production audio tubes, some of which are advertised as “low noise”, as well as a few new, old-stock (NOS) tubes. The tubes have been acquired and tested within the last 5 years (in the case of current production tubes). The list is current as of 22 July 2020, but new measurements are added regularly. The goal is to find the lowest noise audio tube, definitely not to promote any particular type or brand, so please let us know of any tubes you think we should measure and include.
|
Tube Type |
Brand or Manufacturer |
# Tubes | # Sections Measured |
Cathode Current, mA |
Avg. Gain, v/v |
Avg. Input-referred Noise, 30Hz – 8kHz, µV rms (Sample standard dev. in parentheses) |
Integrated Noise Figure, Rs = 390Ω, dB |
|
2SK209 NJFET |
Toshiba |
1 | 1 |
7.0 |
78.9 |
0.253 |
0.9 |
|
12AX7B |
Shuguang |
7 | 14 |
1.45 |
61.0 |
0.588 (± 0.081) |
8.3 |
|
12AX7 |
Tung Sol Reissue (Reflektor) |
6 | 12 |
1.45 |
59.6 |
0.768 (± 0.175) |
10.6 |
|
12AX7 (ECC83S) |
JJ |
6 | 12 |
1.45 |
60.6 |
0.587 (± 0.063) |
8.3 |
|
12AX7WB |
Sovtek (Reflektor) |
5 | 8 (1 hi noise discarded) |
1.45 |
59.5 |
0.735 (± 0.108) |
10.2 |
|
5751 |
JJ |
50 | 90 (5 hi noise discarded) |
1.5 |
54.5 |
0.583 (± 0.057) |
8.2 |
|
12AT7 |
Shuguang |
8 | 16 |
1.95 |
41.2 |
0.698 (± 0.078) |
9.8 |
|
12AT7 (ECC81) |
JJ |
4 | 8 |
1.95 |
37.9 |
1.442 (± 0.361) |
16.1 |
|
12AY7 |
JJ |
3 | 4 (1 hi noise) |
1.8 |
28.2 |
0.725 (± 0.051) |
10.1 |
|
6922 |
Electro-Harmonix (Reflektor) |
3 | 6 |
5.2 |
27.0 |
0.825 (± 0.204) |
11.2 |
|
E88CC |
JJ |
13 | 16 (5 hi noise discarded) |
5.3 |
23.2 |
0.790 (± 0.285) |
10.8 |
|
6DJ8 6922 E88CC E188CC |
Assorted Premium Low-Noise NOS (Telefunken, Philips, Siemens, Amperex – see text) |
24 | 48 |
5.3 |
27.6 |
0.610 (± 0.209) |
8.6 |
|
6SL7GT |
Tung Sol Reissue (Reflektor) |
17 | 28 (3 hi noise discarded) |
1.65 |
42.3 |
0.788 (± 0.127) |
10.8 |
|
6SL7 |
JJ |
3 | 6 |
1.65 |
41.4 |
0.709 (± 0.026) |
9.9 |
|
RU-6H9C |
Sovtek |
20 | 36 (2 hi noise discarded) |
1.65 |
45.3 |
0.586 (± 0.036) |
8.2 |
|
RU-6H9C (2 sections in parallel) |
Sovtek |
3 | 3 |
1.65 x 2 |
45.6 |
0.441 (± 0.026) |
5.8 |
|
ECC99 |
JJ |
4 | 6 (1 hi noise discarded) |
7.5 |
19.7 |
0.711 (± 0.057) |
9.9 |
|
RU-6H6 |
NOS Russian |
2 | 4 |
7.9 |
15.8 |
0.819 (±0.268) |
11.1 |
|
RU-6H16 |
NOS Russian |
3 | 6 |
5.5 |
19.7 |
0.813 (±0.026) |
11.1 |
|
6267/EF86 (EF806S) pentode |
JJ |
6 | 6 |
1.45 |
156 |
0.931 (± 0.213) |
12.3 |
|
6267/EF86 (EF806S) triode |
JJ |
6 | 6 |
1.45 |
28.6 |
0.958 (± 0.259) |
12.5 |
|
D3a |
Siemens NOS (see text) |
4 | 4 |
7.0 |
60.9 |
0.412 (± 0.067) |
5.2 |
|
RU-6C45PI |
Sovtek |
2 | 2 |
8.6 |
39.1 |
0.389 (± 0.019) |
4.7 |
|
12AX7 |
Assorted NOS (see text) |
5 | 10 |
1.45 |
52 – 62 |
0.9 – 2.3+ |
12 – 20+ |
|
6SL7GT |
Assorted NOS (see text) |
6 | 12 |
1.65 |
43 – 49 |
0.658 – 1.7+ |
9.2 – 19+ |
Table 1: Summary of measurement data. The average input-referred noise of all the tube sections is listed, followed by the sample standard deviation (σ) in parentheses. The integrated noise figure is based on a 390-Ω source resistance, using the average input-referred noise. See text.
Fig. 1 below shows a block diagram of the measurement setup. The output of the test circuit (“device under test”) goes to a 100X amplifier and C-weighting filter, which has a 30 Hz – 8 kHz second-order bandpass response. Then it is applied to Picoscope 4262 PC-based oscilloscope to determine the RMS value of the output noise. In a separate measurement, a 1 kHz input signal is applied to the device under test to determine its gain. Finally, the input-referred noise is calculated by dividing the RMS noise measured by the PC oscilloscope by the gain of the device under test and 100X amplifier. The noise contribution of the 390-Ω source resistance (see Figs. 2 - 3 below) is not subtracted from the input-referred noise, but it is a small contribution, and it is accounted for in the noise figure calculation below.

Fig. 1: Block Diagram of Measurement Setup
The noise figure is calculated for a 390-Ω source resistance. There is nothing special about the 390 Ω; it is just a convenient value similar to the resistance of a moving magnet phonograph cartridge. The noise figure in decibels is calculated as:
NF = 20*log (ni / 0.227 µV),
where ni is the measured input-referred noise (in µV rms) and 0.227 µV is the 27°C thermal noise of the 390-Ω resistor. For an ideal noiseless tube, the input-referred noise of the circuit would be 0.227 µV and the noise figure would be 0. The 100X amplifier and filter circuit is described elsewhere on this website (http://tavishdesign.com/pages/downloads).
Multiple samples of each tube are tested, and the average input-referred noise is tabulated for each type and brand. The sample standard deviation (σ) is also calculated. Tube samples with input-referred noise more than 4σ above the average are not included in the data, but are noted in column 3 as “discarded.” Histograms summarizing all the measurements on the JJ 5751, JJ E88CC, and Tung Sol Reissue (Reflector) 6SL7GT are included as Figs. 17 – 19 at the end of this paper.
The test circuit depends on the type of tube being measured. Figures 2 through 4 below show the test circuits for 12AX7, 12AY7 and 12AT7 tubes, for 6DJ8 / 6922 / E88CC types, and for the 6SL7GT, respectively. Figures 5 and 6 are test circuits for the 6267 / EF86, as a pentode and as a triode, respectively. Figures 7 and 8 are test fixtures for the D3a and ECC99, respectively. Fig. 9 is a recently added test fixture for the RU-6C45PI, and Fig. 11-A is a test fixture for the RU-6H16 subminiature type.
As a comparison with the tube noise measurements, and as a check on the noise floor of the test setup, the noise of a Toshiba 2SK209 low-noise audio JFET has been measured. The 2SK209 test circuit is shown in Fig. 10 below. The 52 volt power supply is provided by six 9-v batteries in series, to avoid any powerline harmonics. The 30 Hz – 8 kHz integrated input-referred noise of the 2SK209 was 0.253 µV RMS with the switch open and 0.142 µV with the switch closed. The root-square difference is 0.209 µV, which is the noise attributable to the 390-Ω resistor, very close to the theoretical value of 0.227 µV. The 2SK209 NF referred to 390 Ω is
NF = 20*log (0.253 / 0.227 µV) = 0.94 dB,
much lower than any tube measured in this study.
Note that any of the devices tested in this study could be wired with multiple devices in parallel to reduce the input-referred noise. As an example, the two sections of an RU-6H9C (6SL7GT) were tested in the circuit shown in Fig. 11 below. The average input-referred noise of the paralleled sections was 0.441 µV RMS with the switch open and 0.379 µV with the switch closed. This is roughly a 2 dB improvement over the noise of a single device, compared to the theoretical 3 dB improvement, and is typical of what is actually seen in practice when paralleling discrete devices.

Fig. 2: Test circuit for 12AX7, 12AY7 and 12AT7

Fig. 3: Test circuit for 6DJ8 / 6922 / E88CC

Fig. 4: Test circuit for 6SL7GT

Fig. 5: Test circuit for 6267 / EF86, as a pentode.
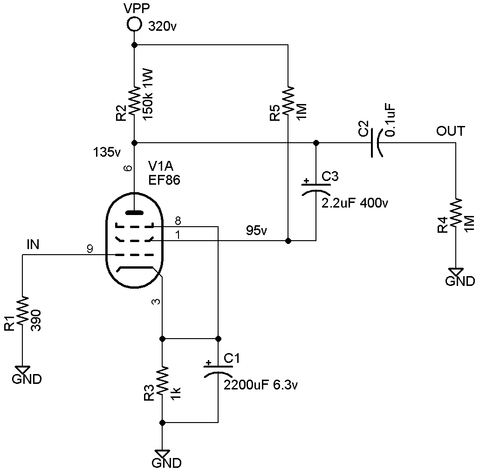
Fig. 6: Test circuit for 6267 / EF86, as a triode.

Fig. 7: Test circuit for D3a, as a triode.

Fig. 8: Test circuit for ECC99 and RU-6H6.

Fig. 9: Test circuit for RU-6C45PI.

Fig. 10: Test circuit for Toshiba 2SK209 JFET.

Fig. 11: Test circuit for 6SL7GT with the two sections wired in parallel.

Fig. 11-A: Test circuit for RU-6H16.
The test circuits are each built on a copper-clad PC board in a grounded aluminum box, as shown in Photo 1 below. The 6.3-VDC heater and 320-VDC plate supplies are filtered and regulated to eliminate 50/60 Hz powerline harmonics, and the Picoscope is used in spectrum analyzer mode to verify that there are no significant powerline harmonics in the output noise spectra. Hence, these noise measurements evaluate white (thermal) noise, 1/f noise, and other inherent device noises in the 30 Hz – 8 kHz range. They do not evaluate susceptibility to 50/60 Hz hum when AC is used on the heaters; 50/60 Hz hum can be (mostly) eliminated by correct circuit design and implementation.
Figures 12 – 14 below show captured waveforms and spectra from the Picoscope. They are all taken from a Tung Sol Reissue 12AX7 but are typical of the noise seen. Fig. 12 is a time domain noise waveform at the output of the C-weighting filter. This is a noise level of 5.45 mV RMS, which corresponds to an input-referred noise of 0.89 µV RMS. Fig. 13 is a corresponding frequency domain noise spectrum with 20 kHz bandwidth; in this spectrum, the 8 kHz bandwidth of the C-weighting filter can be clearly seen. Fig. 14 is a noise spectrum with 1 kHz bandwidth, and the 30 Hz cutoff of the C-weighting filter can be seen here.
The limited number of tubes measured is just a tiny sampling of current production tubes, and since tube production varies from lot to lot, it is important not to read too much into the relative noise figures. As a comparison, 5 new old-stock (NOS) 12AX7 tubes and 6 NOS 6SL7GT tubes acquired in the 1970’s and 1980’s were also measured (see comment on NOS Siemens D3a, discussed separately below). These NOS 12AX7 and 6SL7 tubes (which included RCA, Sylvania, GE, Mullard, Telefunken, and Amperex) are typically much noisier than the current production tubes tested. Tubes tend to get noisier over time whether they are used or not, so NOS tubes are not generally a good bet if low noise is a criterion. However, a couple of the NOS 6SL7GT tubes had remarkably low noise, in the range of 0.65 – 0.7 µV rms, better than many current production 6SL7GT tubes measured. Unfortunately, these 60-year-old NOS gems (which are pictured on the "Downloads" page) are the exception rather than the rule; most NOS tubes tested had higher noise than current production tubes of the same type.
We had the opportunity to measure a collection of 24 NOS 6DJ8 types (6922, E88CC, E188CC) that had been previously selected for low noise. These premium tubes included Telefunken, Philips, Siemens, Amperex, and Valvo tubes from the 1960s and early 1970s. A tube enthusiast and collector spent much time and money assembling this collection, which is definitely not representative of typical NOS 6DJ8 tubes now available. They had an average input-referred noise of 0.61 µV rms, with a ±0.21 µV rms sample standard deviation. There were 9 tube sections which measured < 0.5 µV rms. The 6DJ8 has a reputation for low noise, and this collection of tubes shows why. Unfortunately, the current-production 6DJ8 types we’ve tested are not nearly so good. Fig. 20 shows a noise histogram for these 24 NOS tubes, with a few very noisy sections omitted, since they would lie off the right of the graph. Figs. 21-24 show photographs of this collection under test.
The current production JJ E88CC is puzzling due to its high variability. Some samples show input-referred noise ≤0.55 µV rms, while others had such high noise that they had to be discarded.
Comparing the current production and NOS tubes does tell us that most of the current production tubes measured in Table 1 are pretty good. On the other hand, the >10 dB variation in noise figure among the current production tubes tested can be quite significant in a low noise circuit like a phono stage. And, the tubes selected for test in Table 1 were chosen from among those promoted as being “low noise”, so it is likely many current production tubes are noisier.
The recently measured NOS Siemens D3a tube seems to be an outlier in this study. The D3a/7721 is a high transconductance VHF amplifier designed to have very low shot noise. But since noise in the audio range tends to be dominated by other mechanisms (such as 1/f noise, among others), a low noise RF tube may not necessarily have low noise in the audio range. But the D3a does display very low noise, almost 3dB better than the next best tubes. Unfortunately, the four samples we measured were also quite microphonic in our tests. Fig. 15 below is a frequency domain spectrum of the microphonic response of a D3a. It was obtained by tapping gently on the aluminum box (with the cover removed), then waiting 0.3 – 0.5 seconds and capturing the waveform at the output of the noise measurement amplifier. There are distinct vibrational modes at 3.2 kHz, 4.2 kHz, and 4.8 kHz, along with a broad spectrum from 12 – 17 kHz. The modes at 3.2 – 4.8 kHz damp out within a few seconds, but the spectrum from 12 – 17 kHz can persist for 30 seconds or more. All four tubes showed nearly identical behavior. In contrast, identical tests on the JJ E88CC and Tung Sol Reissue 6SL7GT showed at least a factor of 10 lower microphonic response, which damped out so quickly that it was difficult to capture by this method. Keep in mind that these results on the D3a are based on only four tubes obtained from a single source. We are looking for more samples to test.
The current production Sovtek RU-6C45PI has similar construction to the NOS Siemens D3a and also displays similar very low noise. The 6C45PI also has similar microphonic behavior. Measured in the same way as for the D3a, there is a distinct vibrational mode at 3 kHz and a broad spectrum from 12 – 17 kHz, as shown in Fig. 16 below. There are more minor modes at 800 Hz, 4.8 kHz, and 6.8 kHz. Once again, the mode at 3 kHz and the other minor modes damp out within a few seconds, but the spectrum from 12 – 17 kHz can persist for 30 seconds or more. Only two Sovtek 6C45PI have been measured and both showed similar microphonic behavior. Based on this very small sample set, the 6C45PI seems slightly less microphonic than the D3a, but both tubes are much more microphonic than other audio tubes in this study.
We also measured samples of another NOS RF tube, the 6GK5 / 6FQ5A, in an attempt to find low noise similar to that of the D3a and 6C45PI. The 6GK5 / 6FQ5A is a high-transconductance frame-grid VHF triode, sort of a mass market cousin to the D3a. Unfortunately, the low-noise magic of the D3a does not extend to the 6GK5 – we tested more than 10 and the best of them had input-referred noise around 1.5µV rms in the audio range.
Do you have any suggestions for low noise audio tubes (current production or NOS)? Please let us know!
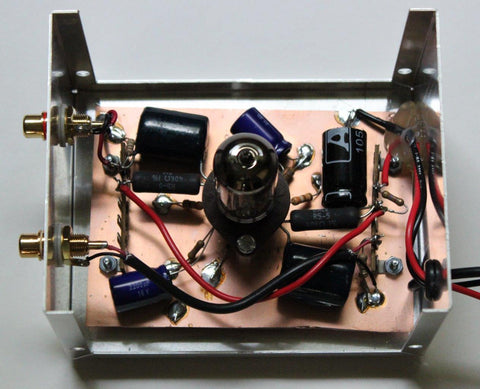
Photo 1: Test fixture built into a 3” x 4” x 5” aluminum box (cover removed).

Fig. 12: Time domain noise waveform at output of C-weighting filter for a Tung Sol Reissue 12AX7.
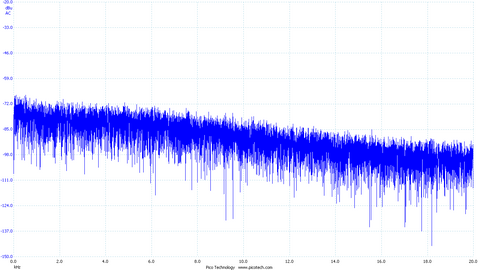
Fig. 13: Frequency domain noise spectrum (20 kHZ BW) at output of C-weighting filter for a Tung Sol Reissue 12AX7.

Fig. 14: Frequency domain noise spectrum (1 kHZ BW) at output of C-weighting filter for a Tung Sol Reissue 12AX7.
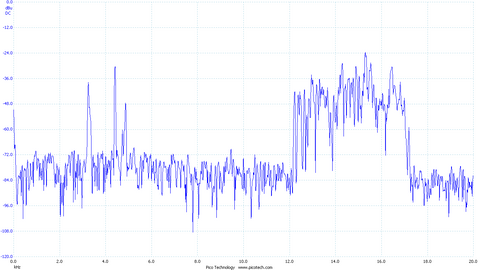
Fig. 15: Frequency domain spectrum of the microphonic response of a D3a.

Fig. 16: Frequency domain spectrum of the microphonic response of a RU-6C45PI.

Fig. 17: Noise measurement histogram for JJ 5751.

Fig. 18: Noise measurement histogram for JJ E88CC.

Fig. 19: Noise measurement histogram for Tung Sol Reissue (Reflektor) 6SL7GT.

Fig. 20: Noise measurement histogram for NOS 6DJ8 types (6922/E88CC/E188CC). See text. These are not typical NOS tubes and are not necessarily representative of most NOS 6DJ8 now available.

Fig. 21: NOS 6DJ8 collection

Fig. 22: NOS Telefunken 6DJ8/6922 under test
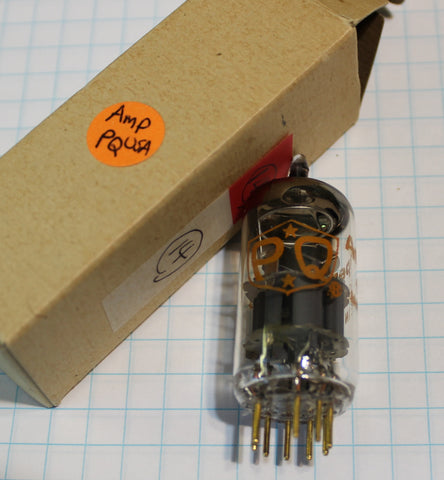
Fig. 23: One of the NOS Amperex 6922 PQ tested in this study

Fig. 24: One of the NOS Philips E188CC SQ tested in this study
Copyright, Trademark, and Disclaimers
© Copyright Tavish Design, LLC 2020. All rights reserved. No part of this document may be reproduced by any means or translated to other languages without prior written consent of Tavish Design, LLC.
Tavish Design® is a registered trademark of Tavish Design, LLC.
The information provided here is subject to change without notice. Tavish Design, LLC is not responsible for errors contained herein or for consequential damages resulting from the use of this material.